https://follow.it/elliottwave-edge?leanpub

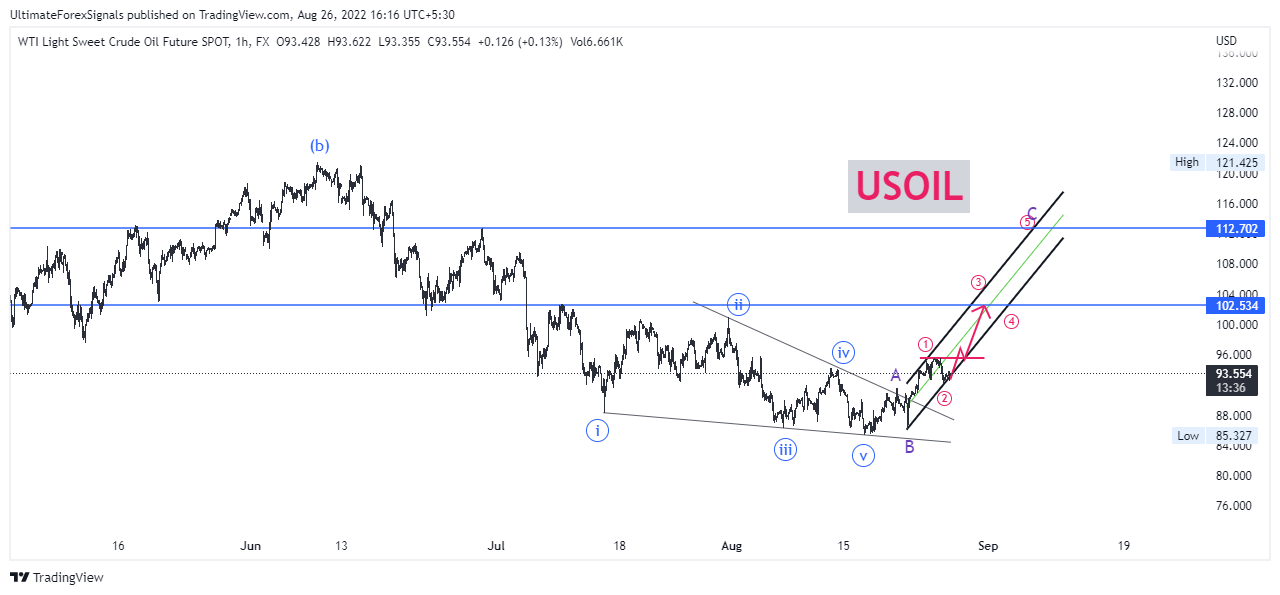
USOIL Forecast - Bulls eye for $104


USOIL 1H Chart :

USOIL


As shown in chart, Doentrend as Ending diagonal has been completed $85.300 and new ABC or impulse is begun. USOILcurrent price  at $93.500

If we consider as "ABC" then "C" wave is unfolding as five waves 1 2 3 4 5. 

If 3 wave is min 100% of wave 1 then our first target is 101 and if it will be extended then we may see 104/108/112.

https://follow.it/elliottwave-edge?leanpub

S&P 500 weekly forecast for 22 to 26th Aug 2022

As we discussed in the previous article, S&P 500 Elliottwave Set-Up: Levels for this week 

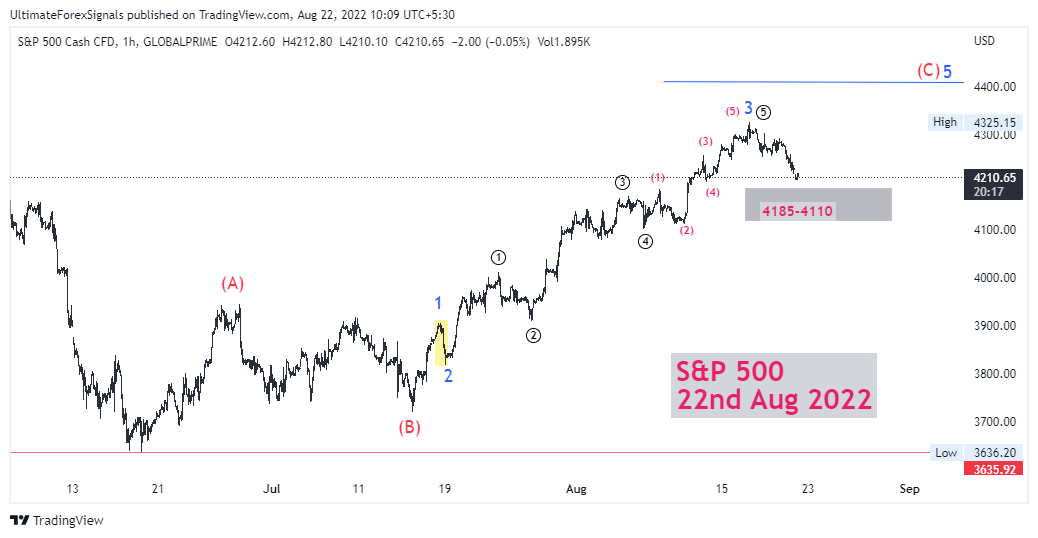
As shown in Chart ABC correction is unfolding on 1 Hour Time frame.C wave has always five motive waves as 12345 

Wave 1 was 3720-3910

Wave 2 was a zig-zag correction and deep So as per alternation rules we may see the 4th wave as shallow and complex.

Wave 3 is fast and furious up to 4300. So I have mentioned that 3rd wave finished at 4300 and we may see 4th wave correction. 

Let's do a fresh analysis.

S&P 500 1H Elliott Wave Chart:


S&P 500 Elliott wave analysis


As shown in chart, 3rd wave high 4325 and then after abc correction is unfolding.

abc correction forecast:

SPX 500


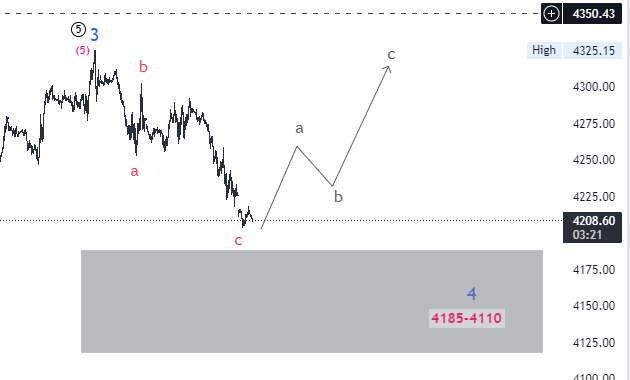
As shown in 15 min chart, abc as flat correction is complete near 4205 and assume as c wave is completed.now we may see zig-zag abc towards 4300 as shown in the chart.

If the price starts to trade below 4200 then we may see 4180/4115 as continuing c wave.

On a higher time frame, SPX 500 is in 4th wave continuing.

Bulls will try to hold 4200 for 4250/4300
Bears will try to close below 4200 for 4180/4150/4118

Weekly forecast of Gold (XAU/USD) for a week 22nd-26th Aug 2022

 As we discussed, Gold Correctio WXYXZ Pattern analysis on week end 19th Aug 2022

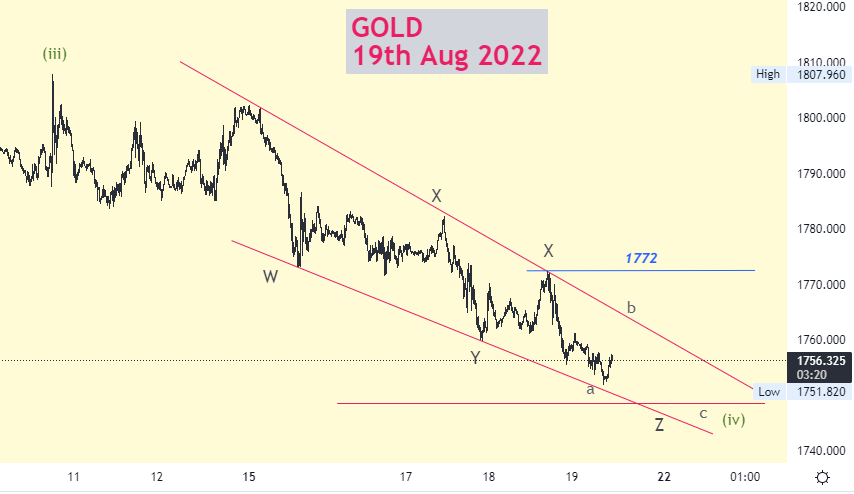
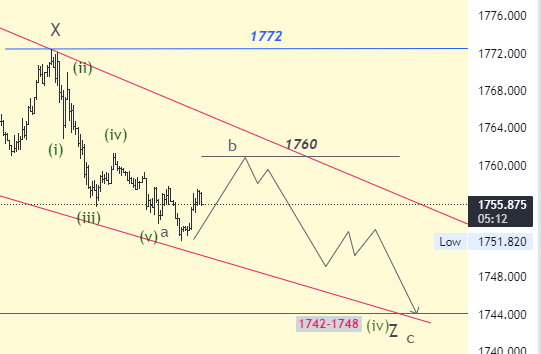
First "a" wave of "Z" wave is completed as five waves and "b" wave as the inverted flat is unfolding. We may see the final "c" wave after the completion of the "b" wave.

"b" wave may finish between 1760-1770 and the final "c" wave between 1742-1750.

If the price moves above 1772 then we may consider Low 1751 as the bottom and up rally started and we will wait for Buy in correction.

If the price break 1740 then this analysis is nullified and the downtrend intact.

Now Let's fresh analysis again,

Gold 1H Chart :


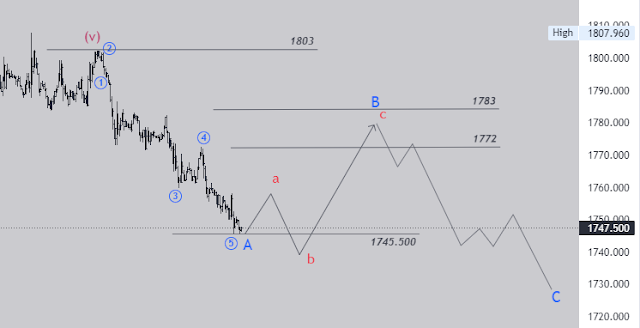
I have labeled 1681 to 1803 as five waves completed as I,II,III,IV and V.

As alternation, II wave was complex and IV was sharp correction gave confidence to labeling as given in chart. An interesting thing was seen wave V failed fifth wave completed at 1803.

In general, after failed fifth wave correction is deep and last longer as appeared from 1803 to till date 1745 in just 5 days. 

ABC (5-3-5) Correction :

GOld forecast


After five impulses, correction of the entire five impulses has to be seen. This correction is shown as ABC Zig-Zag (5-3-5) in which A wave as 12345 is almost completed. 

Let's Forecast "B" wave (3 waves as abc) for the coming week:


B wave correction will have also 3 waves as abc.

Now, abc will be unfolding which type of correction? Clue of this skill gives a successful edge in trading. 

Three types of corrections, 

1.Flat (Simple & Inverted) (3-3-5)

2.Zig-Zag (5-3-5)

3.Triangle (3-3-3-3-3)

The principle of alternation works in most situations. As we have seen A wave as five wave , we expect B wave as flat (Simple or Inverted). 

If it will be a Simple flat then price will again see near prior low 1745 as sub-wave"b" after sub-wave "a" above 1750.

If it will be an Inverted flat as mentioned in the chart then we may see one more Low between 1735-1742 as sub-wave"b" 

sub-wave "c" may see between 1767-1783 and will discuss after the completion of sub-wave b. 

Gold Correctio WXYXZ Pattern analysis on week end 19th Aug 2022

 As we discussed in a previous analysis, Gold price Elliottwave Outlook gold is in the "WXYXZ" pattern.

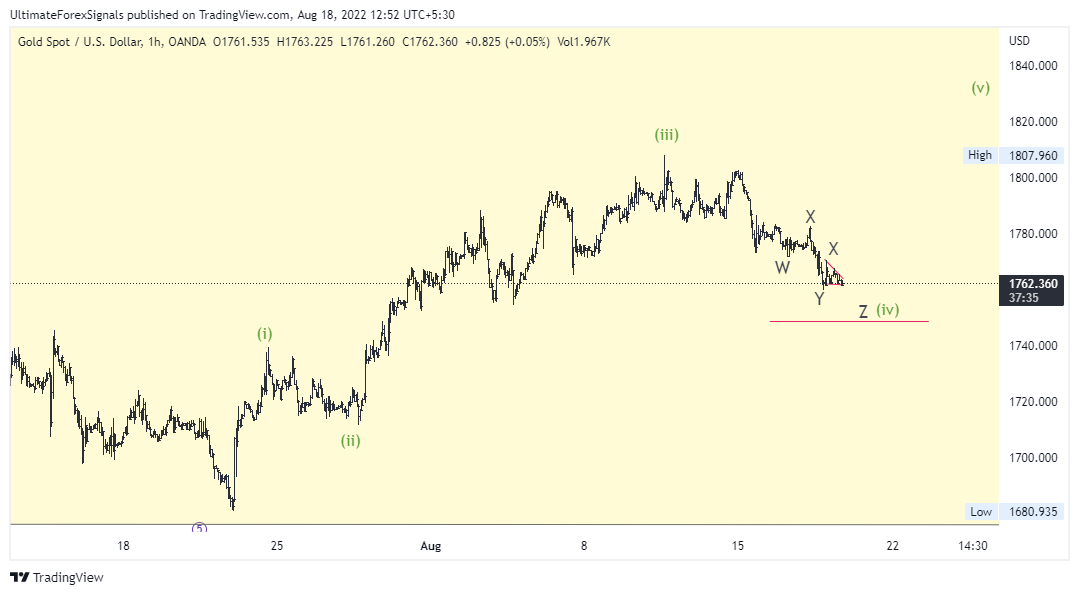
Gold is in IVth wave complex correction. WXY or WXYXZ correction is unfolding if stays above 1740.

Bulls need to hold 1740 for the upper rally.

Gold


As shown in chart "Z" the wave is unfolding of WXYXZ.

Here W wave is Flat, Y wave 3-3-3, and Z wave is developing as abc Zig-zag (5-3-5).

XAU/USD Elliott wave


First "a" wave of "Z" wave is completed as five waves and "b" wave as the inverted flat is unfolding. We may see the final "c" wave after the completion of the "b" wave.

"b" wave may finish between 1760-1770 and the final "c" wave between 1742-1750.

If the price moves above 1772 then we may consider Low 1751 as the bottom and up rally started and we will wait for Buy in correction.

If the price break 1740 then this analysis is nullified and the downtrend intact.

Gold price Elliottwave Outlook

Gold 1H Chart :


XAU/USD

As discussed in previous analysis,

Gold is in IVth wave complex correction. WXY or WXYXZ correction is unfolding if stay above 1740.

Bulls need to hold 1740 for the upper rally.

Let's see 15 min chart.


 "W" wave as abc flat correction.
"X" wave also has 3  sub waves.
"Y" wave as Zig-zag 5-3-5 correction.
"X" wave also has 3  sub waves.
"Z" wave seems like a triangle unfolding.

IV wave may give deep retracement 50%
 @ 1860 & 61.8% retracement @1848 of (III wave)  

Gold may see a swing around these levels. 

Alternate Scenario: If the Price closes below 1840 then the short-term downtrend may be intact.

Ethereum ETH/USD Elliott Wave Analysis - 17th Aug 2022

 Ethereum 1H Elliottwave Chart :

Ethereum ETH/USD Elliottwave chart


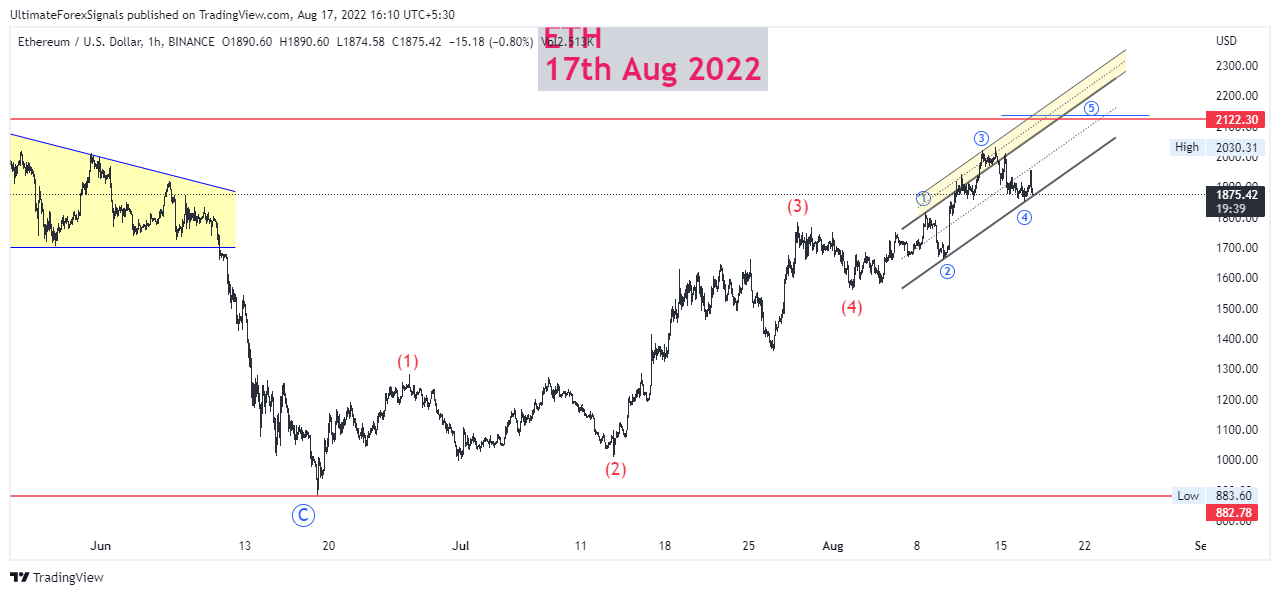
I have counted the waves from Low 880 as shown in the chart

Wave 1 is normal and wave 2 was flat & deep correction.

Wave 3 was more than 161.8 % (1st )

Wave 4 was 23.6% (3rd)

Forecast 5th Wave:

Sub-waves of 5th wave as 12345

As shown in the chart sub-waves 1,2,3 is almost completed.
sub-wave 4 is unfolding.

So where we should enter? Price at 1875 

Any Buy at this level should have Stoploss, top of sub-wave 1 at 1818 and target towards 2000/2100

If the price break below 1818, we have to count again. 


S&P500 Elliottwave Set-Up: Levels for this week.

S&P 500 Elliott Wave Analysis : 

SPX 1H Frame :

S&P 500 Elliott Wave Analysis


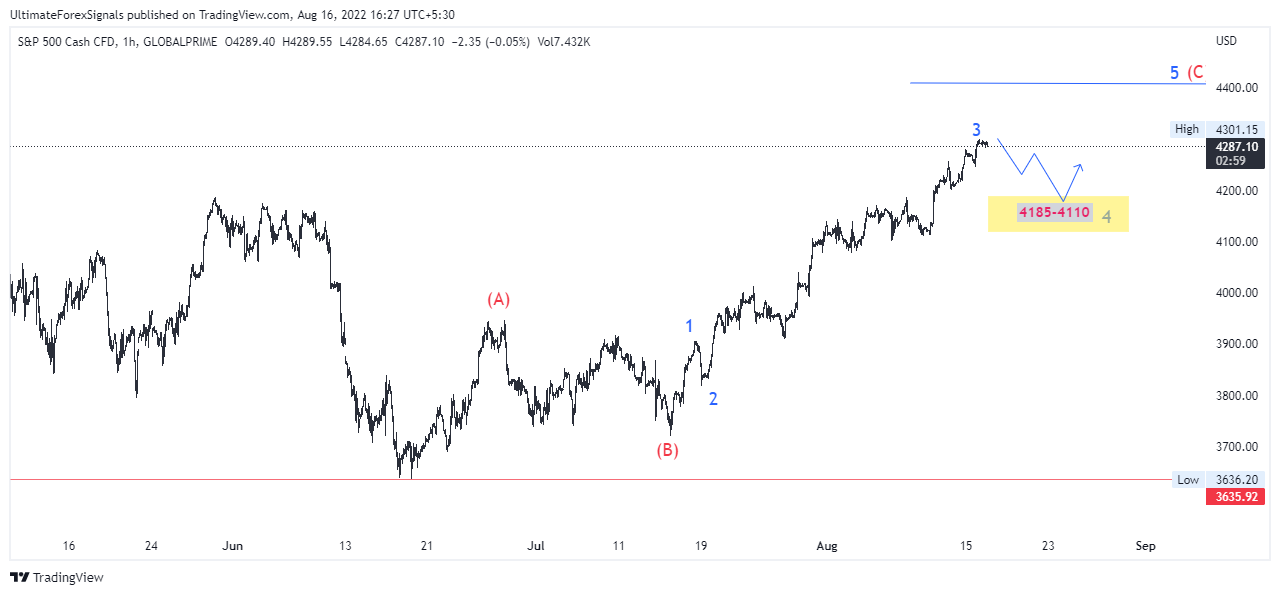
As shown in Chart ABC correction is unfolding on 1 Hour Time frame.C wave has always five motive waves as 12345 

Wave 1 was 3720-3910

Wave 2 was a zig-zag correction and deep So as per alternation rules we may see the 4th wave as shallow and complex.

Wave 3 is fast and furious up to 4300. So I have mentioned that 3rd wave finished at 4300 and we may see 4th wave correction . 

The time of the 4th wave may be longer as we have seen 2nd wave has taken very less time.

Let's forecast the 4th wave :

Fibonacci 23.6% (3) is at 4188
Fibonacci 38.2% (3) is at 4118

So the above two levels are important to Buy, and we will further re-visit the chart near these levels in the coming days.