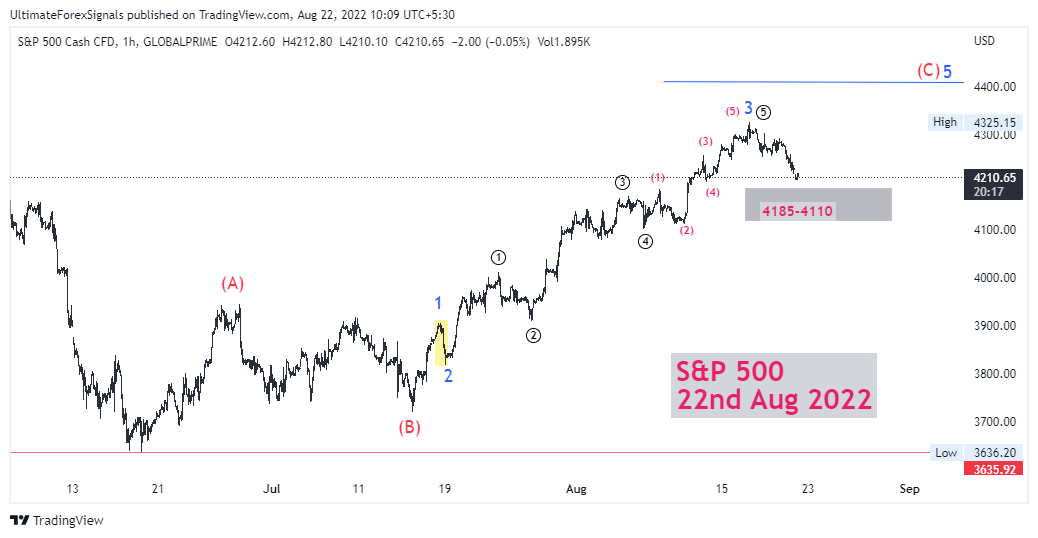
As shown in Chart ABC correction is unfolding on 1 Hour Time frame.C wave has always five motive waves as 12345
Wave 1 was 3720-3910
Wave 2 was a zig-zag correction and deep So as per alternation rules we may see the 4th wave as shallow and complex.
Wave 3 is fast and furious up to 4300. So I have mentioned that 3rd wave finished at 4300 and we may see 4th wave correction.
Let's do a fresh analysis.
S&P 500 1H Elliott Wave Chart:
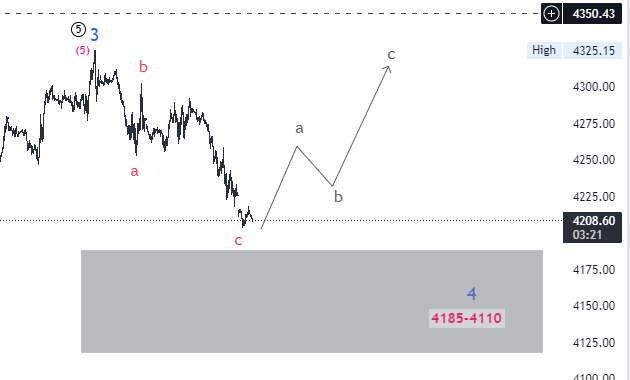
As shown in chart, 3rd wave high 4325 and then after abc correction is unfolding.
abc correction forecast:
If the price starts to trade below 4200 then we may see 4180/4115 as continuing c wave.
On a higher time frame, SPX 500 is in 4th wave continuing.
Bulls will try to hold 4200 for 4250/4300
Bears will try to close below 4200 for 4180/4150/4118


No comments:
Post a Comment